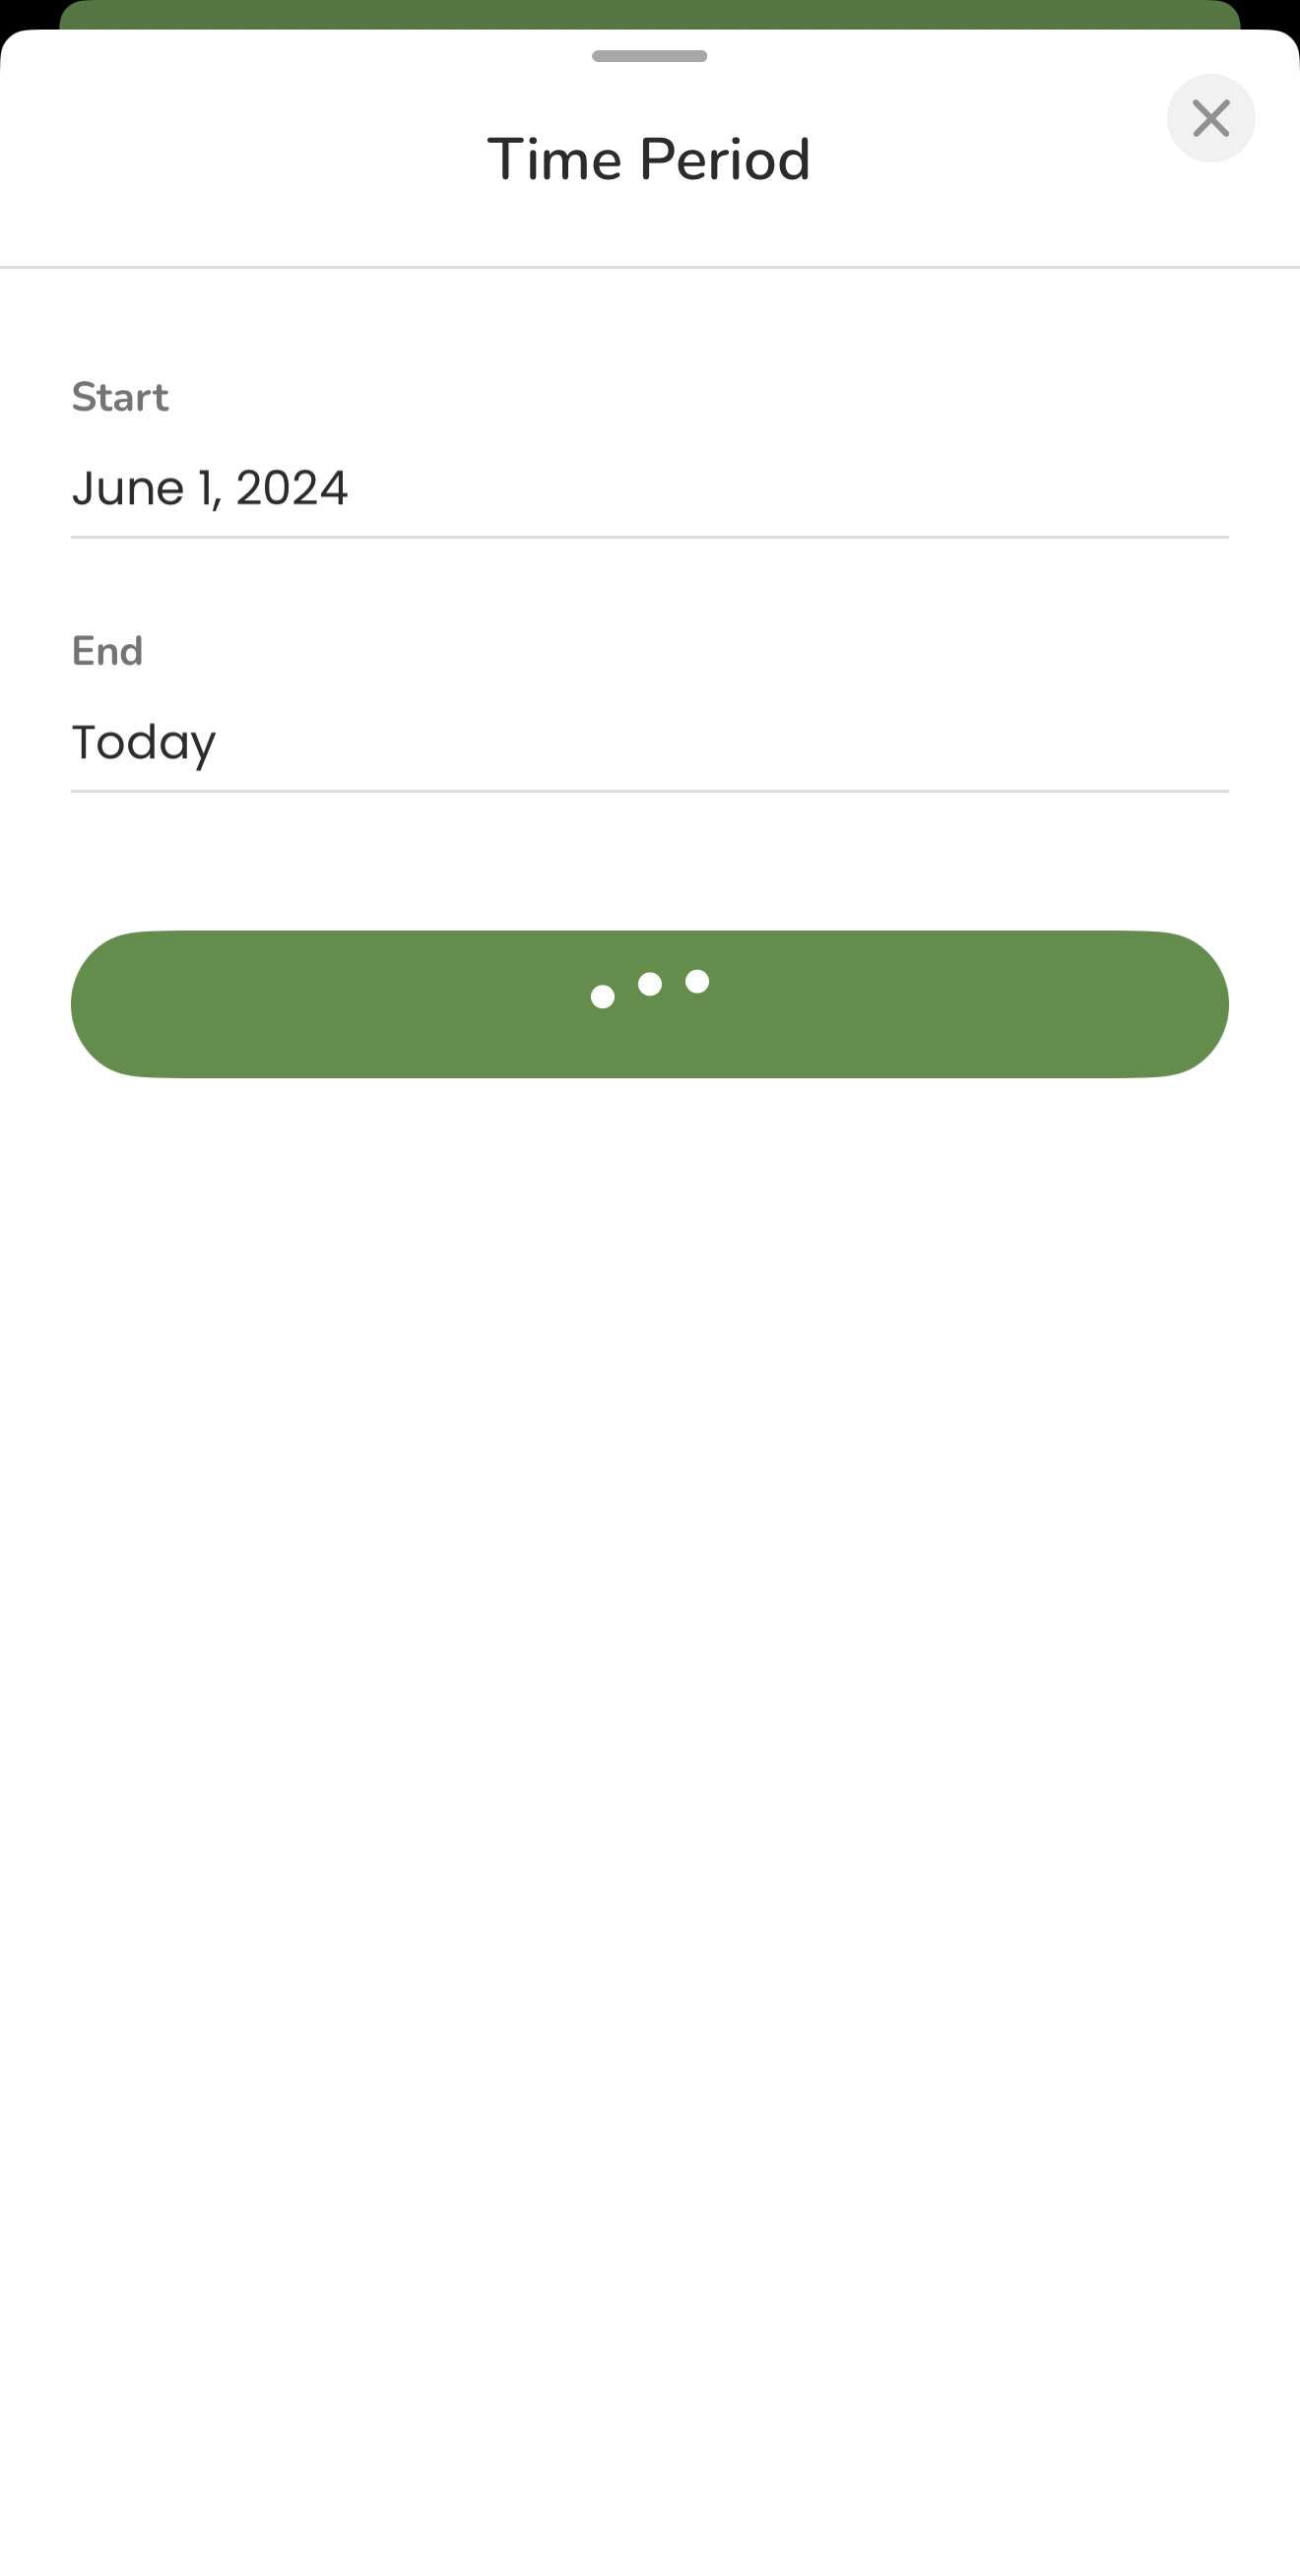
Chart Custom period not working
In a chart, chose Custom period, selected any start and end date and select Save. The Save button is changed to a animated « … » and keeps showing this animation.
Please authenticate to join the conversation.
Upvoters
Status
Complete
Board
🛠️
Bug Reports
Date
Over 1 year ago
Author

Tom
Subscribe to post
Get notified by email when there are changes.
Upvoters
Status
Complete
Board
🛠️
Bug Reports
Date
Over 1 year ago
Author
Tom
Subscribe to post
Get notified by email when there are changes.